CasperJS + PhantomJS on Mac - First Test

1. Installation of CasperJS : open the Terminal and fire up these commands
$ brew update
$ brew install casperjs --devel

To test if the installation of casperjs was successful, type on terminal
$ which casperjs

you should get - /usr/local/bin/casperjs which means everything is fine
2. Install PhantomJS : open the terminal and fire up these commands
$ brew install node

This will install node. After which you can use the node/npm without using sudo
$ npm install -g phantomjs

To test if the installation of phantoms was successful, type on terminal
$ which phantomjs

you should get - /usr/local/bin/phantomjs which means everything is fine

Now you are all set to write your first test. Make sure you have BBEDIT installed ( best Code editor , i have seen ). Here, is a sample first test script for you

Remember to run this command in terminal, this will take care of your blank screenshots and https:// requests if any
$ casperjs --ignore-ssl-errors=yes --ssl-protocol=any caspertest.js

Cross Browser Playback in CodedUI

In effect , Cross Browser Playback is only useful to actually check UI differences between the different browsers. So the popular belief of replaying all the tests for testing the cross browser is just a myth. To improve your effectiveness, you may want to target specific tests at specific known UI problems in your app.   
Cross Browser Playback enables you to validate if your app is usable from different browsers. It also makes sense to create a few core end 2 end scenario’s you want to validate before you ship like purchasing an item from an online shop. You can also focus on critical business function that would seriously impact your business when stuff breaks. Thereby making playback resilient tests is crucial here so just ensure that your controls are  easy to identify, e.g. by ID across browsers

image

So, how do you get the ability to run the UI web tests you created in multiple browsers? First you need to have Visual Studio 2012 Update 1 or higher. So, this will not work with Visual Studio 2010 if you have not yet upgraded yet to the latest version of Visual Studio. The next thing you need to do is you need to go to the Visual Studio Gallery and there search for cross browser. Then you will find the Selenium components for Coded UI Cross Browser Testing. You can then download the installer, and then you need to install this package on every machine you want to play back the tests. So, when you have multiple test machines that are part of a test lab environment, for example in Team Foundation Server Lab Management, then you need to go to all these machines and install this package. You can also search for this package from the Visual Studio IDE. There you can go to the Tools menu, and there you go to the Extensions and Update menu. Here you can search the Visual Studio Gallery feed and then install straight from Visual Studio. Another thing of course that you need to install are the browsers Firefox and Chrome in order to play back on those browsers. One last thing to note is rather important, and that is that you can only record with Internet Explorer. So, if you choose to use the UI map files that we've discussed in the previous modules, then you can only record using Internet Explorer. You can still play back those recordings using the other browsers, but the recording itself needs to be done from IE.

Understanding cross Browser Playback
image
Look at the architecture of CodedUI. To understand how cross browser playback works we have to look at the bottom layer of this architectural diagram again. We know that CodedUI can work for any technology we'd like as long as there's a driver that can plug into the technology manager layer, and then we need to be able to select the right driver to run the test. Now, for cross browser playback what Microsoft did is write a switch in the web driver that can switch between the two technologies for playback. It still uses the standard implementation leveraging the MSHTML/DOM of Internet Explorer, but they now added the option to switch to a different engine called Selenium. Selenium is a technology solidly designed for browser testing. Selenium has the ability to play back scripts on different browsers for a few years now, and rather than building a competing technology, Microsoft adapted their engine to use the Selenium web driver to run the tests. You might ask yourself but what about Safari? I don't see that browser here in the playback browser symbols. Unfortunately that's true. There's no web driver in Selenium as well for supporting Safari, so that means that we can only play back on other WebKit-based browsers like Firefox and Chrome. This can give at least some confidence that it might work in the Apple WebKit-based browser, but unfortunately Google forked their implementation of WebKit for their browser so it becomes more likely each day that you will not find issues that might occur in Safari-based browsers because the browsers don't use theexact same rendering engine anymore.

How to Switch Browser on Playback
So, now we know what to install and how it works, but what do we need to do in our code to make this all work? The good news is almost nothing. The fact that Microsoft provides an implementation of their web driver in CodedUI that can switch technologies for playback makes switching browsers a breeze. The key element of making the switch is setting the current browser property of the BrowserWindow class. So, what we need to do is we need to specify the browser we want to use for playback. If we don't specify anything or IE, then this means it will be played back in Internet Explorer. If we set the current browser property to contain a text string Chrome before we call BrowserWindow.Launch, it will launch the Selenium Chrome web driver to run the test. If you specify the string Firefox, then it will use the default Selenium implementation that plays back on Firefox. One thing we of course also need to do is install the correct browsers on the machine, so we do need to install Google Chrome, Firefox, or Internet Explorer on the machine that runs the test.


Unsupported Features & Known Issues
So, there are a few caveats to look out for when using cross browser playback. Of course the thing we already discussed, we cannot play back on Safari-based browsers, and that's a problem we cannot fix other than by trying some of the key scenarios by hand and validating every now and then if you see differences in the browser behavior and watch out for those cases. The other problem that you might encounter is that search fails when it normally dependent on a filter to find the right control. A search is executed first based on the search properties, and when multiple controls are returned then a filter is applied to find the control in a set of returned controls. The cross browser implementation does not actually use the filter other than TagInstance, meaning that if your search relies on a filter on some property other than TagInstance of a control then the search will fail. To solve this problem you need to move the filter properties to the search properties. Since all the search properties are translated into a Selenium search, you will see that the search will then succeed. It's always best to try and use search as much as possible and try to keep away from filtering. But when using CodedUI record and playback, the filter properties are used more often, so therefore chances are that this will happen to you when you use record and playback, and it is less likely to happen when you hand code using the object model. Since search in Selenium is done in a different way, it is possible that you can get an error message Error Element does not exist in cache or that your search fails when an element appears delayed on the screen because JavaScript needs to complete on an AJAX call before it shows on the screen. In these cases there is a simple solution to fix this problem. The solution is to use the WaitForControlExist API and before we access any property on the control we can use the WaitForControlExist API to block the call until the control becomes available.

Create Multiple app.config files and run them with pre build events & msbuild


Today we were stumped with having different config files for automation for different environments like QA, Daily runs, BDT etc . While there are various ways, we could have resolved this, each of the methods we thought had one or the other challenge as we needed a single simple solution so that we could service 20 products line.

Also, making changes to the code base did not make sense. So here is how we achieved it

1.  Go to the solution – > right click choose configuration manager. In that screen use the drop down for active solution configuration and choose new. You will be prompted with the new solution configuration as shown below. We added DailyRun as our name.

image

2. Now go ahead and create any number of configuration files you want. Here in our case, we have BDT, DailyRun and Release1 as the configurations for different environment.

(side note : in our solution we had set the original app.config as a content and property always copy. The other configs were left out as it is. As app.config is the main file and that is the one which does all the hard work)

image

3.  Let's create a batch file called "copyalways.bat" and here's the contents:

Put this copyalways.bat file in the root of your project. Basically this batch file will copy a file over another if the files don't match.

4. Create a Pre-build Event. Right-click on your Project and select Properties. Click Build Events and in the "Pre-build event command line" and enter this value:


5. Now if you build, you'll see in the Build Output the batch file being run and the files being copied. Because it's a Pre-Build Event it'll be seen in both the Build Output in Visual Studio .NET.


And there you go. The connection string in the web.config now contains deployment-specific configuration data.

You can add only the parameter part to your build definition now. This will help you run the same solution with different config files.


(Note: we noticed that once the newer app.config is copied , the file was becoming read-only and was not taking in the next build config. The way to solve it would be to make it non read only within the code itself. I will post that code soon).

Done. Here is the complete code of the bat file

Dashboard using ElasticSearch, Logstash & Kibana - 1

All set ? I will try my best to list down the exact steps followed by me to get the ELK stack working on windows. I have tried to get in as much details as possible , special thanks to my co-worker – Kiran, for helping me with this research

This guide was installed successfully on  - Windows 7 Enterprise

Let’s get started

1. Dowload ElasticSearch , Logstash and Kibana from here

2. Create folders in your local drive say c:\Elastic and extract all the folders. So, after it is done, here is how it looks

c:\Elastic\elasticsearch

c:\Elastic\logstash

c:\Elastic\Kibana

Optionally, you can create a new folder say – elasticlogs , which will house the log files, incase you want to dump it there

c:\Elastic\elasticlogs

In the Elasticsearch\bin folder , edit the elasticsearch.yml to include  -

http.cors.enabled: true

Create a logstash config file with


                input {
                file {
                  type => "XMLLogs"
                  path => ["C:/ElasticLogs/*.*","//networkpath/*.*"]
                }
                }
                output {
                 stdout {codec => rubydebug }
                elasticsearch {
                   host => "localhost"
                    protocol => "http"
                    }
                }

3. Download  and install the latest version of Java JDK and install it depending on your OS architecture

4. Set your Java path , to do this

Right click on the My Computer icon on your desktop and select properties

Click the Advanced Tab

Click the Environment Variables button

Under System Variable, click New

Set Java Home Step 2Bullet4.jpg

Enter the variable name as JAVA_HOME

Set Java Home Step 2Bullet5.jpg

Enter the variable value as the install path "C:\Program Files\Java\jdk1.8.0_06" (update your java version accordingly

Click Ok

Click apply changes

5. Install IIS

  1. First, go to Control Panel, and then click on Programs. You’ll see a link for “Turn Windows features on or off”
  2. If you expand the Internet Information Services tree node, you can see that there are a lot of options beneath it. You will probably want to explore these options, because even if you click on IIS, some of the necessary options for doing development aren’t checked.
  3. Once you’ve gone ahead and checked the items you want, and clicked OK, you’ll see this dialog for a while….
  4. Now when you navigate in your browser to localhost, you’ll see the new default page…

6. Open IIS Manager, by going to command prompt and using “inetmgr”  IIS manager will open, now stop the "Default Web Site"

iisstop

7. Create a new website for Kibana as shown below
Right click on "sites" in the left part of IIS Manager and click "Add Website" . In the end it should look something like this
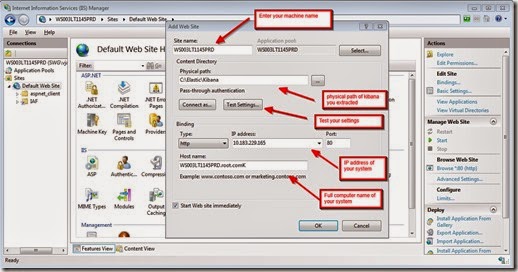
IISwebsiteadd

You can add mime types as below if your IIS version is older

".": application/octet-stream
".json": text/html

8. Start elasticsearch by hitting this in command prompt C:\Elastic\elasticsearch\bin>elasticsearch

9. Check if your elastic search is working by pointing your browser to localhost:9200

You should get something like this.

elasticsearchreply

10. Now reboot your server so you can test that everything is automatically starting on boot.

kib1

Congrats you have installed it!


Some Tips:

To clear elasticsearch cache
1. Install curl - http://www.confusedbycode.com/curl/
2    run from cmd - curl -XDELETE "http://localhost:9200/_all"

Starting logstash
logstash.bat agent -f logstash.conf
 
To check if the logstash config file is correct with parameters
  logstash.bat agent -f logstash.conf --configte

Setting up the Logstash and ElasticSearch to run as an automatic service.

1.  Start elasticsearch and put it on autostart
Open a console and go to "c:\Elastic\elasticsearch\bin\" & type the following command:

service install

You should get service has installed

Now type – service manager and  something similar to below should appear

serv


You have to change on the tab the "Startup type" from Manual to Automatic and then press Apply this should make Elasticsearch start automatically on server boot.
This window contains some more options such as how much memory Elasticsearch will use you can find this on the "Java" tab I would suggest to make this fitting for your server if you have a servers that will handle a huge amount of logs I would increase the "Maximum Memory Pool: 1024" at least to a higher amount.
Before you close the window make sure to press "Start" so it actually will run right now

This is everything to start ElasticSearch automatically on boot to test that it is working open a browser and go to the url you used in IIS  or go to: //127.0.0.1:9200/
If you see a json string something like what you saw in step 9  picture then it means your Elasticsearch is running

2. Create a Logstash startup bat file

A “run.bat" should simply contain this line -

logstash.bat agent –f  logstash.conf

Now place your "run.bat" in the folder: C:\Elastic\logstash\bin

3. Start Logstash & Autostart it
For this step we need another small program to create a proper windows service so please go ahead and download "NSSM" (the Non-Sucking Service Manager)

Once you have the zip file simply unzip it and copy the file from the unzipped folder you now have: "nssm-2.24\win64" (nssm.exe) to "C:\Elastic\logstash\bin" so it should result in you having "C:\Elastic\logstash\bin\nssm.exe".
Now open a Command Prompt and type:

cd c:\Elastic\lostash\bin

nssm install logstash

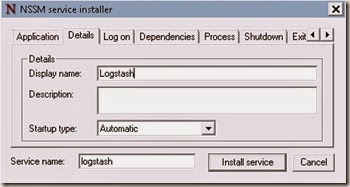
Ensure you have the details filled as below

ser1

ser2

Also make sure that "Startup type" is on Automatic.

Now the following step is additional but recommended if you are 100% going to use Elasticsearch, click on the "Dependencies" tab and add the following: elasticsearch-service-x64

ser3

The reason for this step is that Logstash can do difficult if you have a Elasticsearch output but it is not actually running.
Now this is all so press on the "Install service" button to finish setting up a service for Logstash.

[​IMG]

Now, you actually can stop and start Logstash or Elasticsearch, easily from  "services.msc" as they are now windows services.

OSAFS - The architecture

OSAFS uses a hybrid test automation approach. It has been built on Selenium RC. Components of OSAFS are:
• Global Configuration
• Test Scripts / Test Suite
• Execution Engine
• Reporting Engine
• Exception Handling

OSAFS Layers:


OSAFS Architecture:


Core of OSAFS framework is the Execution Engine. The engine consists of 6 main components:
1.Build.xml: starts the Selenium server and kick –start script execution.
2.OSAFS : is invoked by Build.xml which in turn calls XlateExcelToHtml and XlateHtmlToJava
3.XlateExcelToHtml: converts the test cases in the excel sheet to HTML scripts
4.XlateHtmlToJava: converts the HTML scripts to Java.
5.LogUtil.java (Error handler): When there is an exception it is recorded in “Error. log”
6.log4jConfig.properties : This file has the Config and display details for Error.log

OSAFS takes the input from user in form of Config, Test Cases and TestSuite. The execution engine internally invokes Build.xml to start the Selenium server and kick-start script execution. Error handler is invoked in cases of exception and the log file gets generated. At the end of the execution fairly standard and simple reports in html format are provided to the user

Open Source Automation framework for Selenium - OSAFS

Building an open source automation framework for Selenium would be a good challenge. Let's explore how we can go about designing and implementing a framework that uses a hybrid test automation approach. We shall employ Selenium RC to accomplish this. We can integrate Selenium RC with Test NG(-- a powerful, innovative, extensible, and flexible testing framework for test management) & ANT. We can do this so that we can inherit features from Test NG and Selenium RC.
Feature we can inherit from Test NG

  1. Ability to support both concurrent and sequential execution of scripts
  2. Test report generation
  3. JDK5 annotation support
  4. Flexible test configuration
  5. Data driven testing support with parameters

Hybrid automation framework

Hybrid test automation framework can be considered under fifth generation frameworks, where this framework is a combination of all of techniques, pulling from their strengths and trying to mitigate their weaknesses. This hybrid test automation framework is what most frameworks evolve into overtime and multiple projects
You can implement modularity by nesting test scripts and using the library files (or objects) to implement functions, procedures, or methods. You can implement whichever data-driven technique you choose and to the extent you find it useful. The trick is to use the best framework(s) for the job and the only way to figure that out is to jump in and start using them
Few advantages with this framework are Reusability, Common components handled by standard libraries, the details of the scripts are hidden from the user, and users don’t have to learn the script language to write scripts

Code Coverage using VSTS


Pre-requisite

  • Build having dll’s/exe along with their corresponding pdb’s
  • VS 2008

Limitations:

  • Code coverage of VSTS is limited to 32 bit.
  • 64 bit dll, during instrumentation will throw error. This implies that instrumentation is successful but the 64 bit dll are forcibly converted to 32 bit. We can only proceed only if its compatible on both 32 & 64 bits
  • The tool must be installed on c:\programfiles and not on c:\programfiles<x86>.

Steps to perform code coverage

 
Locating Application Binaries
  • Open Bin folder( should have dll’s & corresponding pdb’s)
  • Make sure that Bin folder is not read only
  • Ensure to backup dll’s in case of roll back
Instrumentation of Binaries
  • Run cmd window using administrator account
  • Change to directory
    1. (For 32 bit)

C:\Program Files\Microsoft Visual Studio 9.0\Team Tools\Performance Tools>

    1. (For 64 bit- Ensure to install vanguard tool)

C:\Program Files\VSCC 10.0>

  • Run cmd window using administrator account
  • Change to directory
  • Execute “vsinstr /coverage <assemblyname>” for all your binaries

If your binary name is ‘test.dll’, then type

vsinstr /coverage D:\Test\TestDLLApp\TestDLLApp\bin\Debug\test.dll

  • After instrumentation we will get 2 additional files. The original Test.dll will be replaced with test.dll.orig and a new Test.dll & Test.instr files will be created
  • Repeat the same for other dll’s
  • Alternatively we can also use the following command: (ensure that we have vsinstr and vsperfcmd utilities in the working folder).

for %i in (*.dll) do vsinstr /coverage %i

Start Code coverage monitoring process
  • In command prompt type “vsperfcmd /start:coverage /output:yourfilename.coverage

E.g. If want to save coverage file in particular folder then give the path of that folder.

vsperfcmd /start:coverage /output:c:\test\sample.coverage

  • Verify if the coverage file is successfully created
Execute Tests
  • Execute the tests (Manual + Automation)
End the code coverage monitoring process
  • In the command prompt, type vsperfcmd /shutdown
  • This shuts down the coverage monitor and saves the coverage data in the coverage file.(w.r.t to above example in c:\test\sample.coverage)
Generate Code coverage report
  • To generate code coverage report Open VSTS select from MenuTest->Windows->Code Coverage Resultsclip_image002

Now click on import button and select the path of .coverage file

clip_image004

Note: In order to retain the results it’s necessary to have the .coverage file along with the instrumented binaries

API Testing best practices

When developing your API tests, keep in mind the following types of test deliverables

1. Test plan

Best Practice: Track all your deliverables as work-items in any test management tool of your choice. This provides a great high-level view of what our API test coverage is

2. BVT’s

BVT means “Basic Verification Tests,” and they do exactly what the name implies. We use BVTs to verify that the basic functionality of a feature is solid enough to self-host the feature.

Best Practice: BVTs should be the first tests you will develop for your API set

If you do this, you’ll automatically satisfy the next best practice:

Best Practice: All public APIs should have BVTs

3. Stress Tests

The purpose of stressing an API is to ensure it doesn’t cause resource leaks, handles low-resource conditions well, and scales well to large input/data usage. The rules of test mix should follow

  • the test must not hog the CPU - give other stress apps a chance to do work
  • the test must have a cleanup mode – usually a cmd line switch you can call the app with to clean up any changes it made to the system
  • the test must be solid – check for out of memory, don’t leak, etc. Don’t cause “false positives” in the nightly stress runs
  • the test must not be focus-based
  • the test must be run in private mode alongside the regular stress mix

4. Performance

Public APIs need performance tests because it is a feature that other code depends on. By using a certain API, developers have certain expectations as to how much time and memory is required by an API.  Execution time and working set measurements are probably the most critical for an API. These two are good indicators signaling when additional investigation is necessary. The issue with performance testing is even small variations in the execution environment or test code can lead to results that are widely inconsistent, or not reliable enough to be used as a metric.

Best Practices:

  • Work with your feature team (dev/test/PM) to appropriately prioritize performance testing for your public APIs
  • Create small, focused tests that minimize outside impact for performance testing.
  • Simple unit tests or basic scenarios are better for performance monitoring
  • Ensure your tests produce consistent results

Structure of a Performance Test

  • Setup a neutral environment – ensure what you are testing is not cached in memory, or flush the process’s working set
  • Take measurements before running the test
  • Run the test/perform the action
  • Take measurements afterwards
  • Diff the results

5. Leak tests

Public APIs can cause memory and other resource leaks just like UI features can. If your APIs are leaking, you’ll generally notice this while running your stress tests. However, just knowing that something leaked doesn’t really help you debug what leaked. If you use the standard test harnesses, you can use the built-in leak testing functionality to generate logs of leaked allocations and resources while you run your tests.

Best Practice: Use the standard test harnesses to inherit basic leak testing functionality

When writing your tests, try not to cache any data as your test is running. Doing this could cause false positives when the harness is run in leak testing mode. For example, if you’re doing your own logging (which you shouldn’t be), you might be storing messages in memory & waiting until the tests are finished before dumping them to disk. If you do leak testing on a per-test basis, the leak testing code will detect your growing internal log array as a leak.

6. Boundary /Error Tests

Boundary testing is usually done after BVTs are complete and checked in. This type of testing includes calling your APIs with invalid input, NULL pointers, empty strings, huge strings, etc. Making your tests data-driven is recommended as it will be easy to add future test cases without recompiling your code.

Best Practice: Use ITE to model and automate your API system for boundary testing.

This category also includes your Security tests. For example, path strings greater than MAX_PATH characters in length, or path strings that include “::$DATA”, etc

7.  Developer regression tests

DRT means “Developer Regression Test”. Generally, these are designed and written by developers. They should be run by developers before any check-ins. The goal of DRTs is to catch heinous bugs before the build process or BVT team does.

Best Practice: Work with your developer to get DRTs written for your public APIs & identify what should be covered in those tests. Make sure he/she is running them before checkins

8. SDK samples

Sample code should be as clear and concise as possible while still conveying the prominent developer scenarios for the API & respecting solid coding practices (e.g. security checks, error checking, etc.) It is the tester’s responsibility to ensure that the sample code works properly and is included in the SDK as appropriate.

Best Practice: Make sure you test the SDK samples for your APIs on daily builds.

9. API Documentation

Part of testing public APIs is verifying that the documentation is complete, clear, and concise.

Best Practice: When writing your API tests, try copying/pasting the function definitions directly from the SDK docs

Automation Challenges

Sometimes these are conveniently ignored. If we can work on getting answers to these, automation engineers( SDET’s) can relax a bit

1. Maintenance nightmares

2. How to simulate eyes/ears

3. Lack of consistency in automation GUID's

4. Non persistent automation GUID

5. Simulating ‘Real’ customers

6. Simulating N number of customers  for performances

7. Test tools and infrastructure are not stable when needed to test a feature

8. Better End to End Automation

---Better End to End (customer scenario) Automation - test execution and authoring; How to get machines to do more of our work.  How to determine what should or should not be automated.

Testing Influence

Another big thing in testing that virtually controls the flow

1. Power of Go/No-go ship decisions

2. Design time input – testability concerns

3. Fighting for bugs – i.e. How to effectively argue against "No one is ever going to do that!" type of arguments

4. Performance being affected by measurement tools

5. Harder to find customer bugs

--What is the issue? Are the customer's bugs harder than they used to be? are we just dumber than we used to be? is it just customer bugs? Why?

6. Test Cycle expanding

--does this mean taking longer?

7. Stabilization phase is too long

8. Stabilization phase is too short

9. Test Environments are more complex, with fewer tools, processes, people or machines to accommodate matrix growth

10. Expanding Test Cycle

---Test Cycle expanding; stabilization phase is too long; estimating time to zero bugs (release ready); a single complete test pass is longer as matrix increases

11. "retaining testers" ???

General Concerns

Some of these concerns could be a more or less like a statement and not necessarily an issue.  But some how i have over hauled all the questions that I think need answers for.

1. After several release cycles, test suites can grow large and unmanageable

2. Code Bloat – duplicate code, unnecessary code, no common libraries

3. Test case redundancy

4. Maintenance

5. Customer scenarios increase testing complexity

6. Number of Testers per developer continues to rise

7. Lab costs rising

8. Harder to find good testers

--I disagree with this. The problem is that we don't make it attractive enough for good people to become testers.

9. Need Specialists

10.Need better training

11.When tools fall short, we revert to manual, which does not attract “best and brightest”

12. Testing career issues – historically in Testing, management was the only way to advance

--Back to the "testers are considered second class citizens" issue

Let me know your thoughts, we can discuss and come out with some pattern to address them.

SMAF - State Machine based test automation framework

Proposed approach for the harness

Problem statement

Create a model based intelligent automation harness that would make testing cheaper, faster and better.

Approach considerations

Address the # 2 of the disadvantages of Model based testing

Creating a state model

Model-based testing solves these problems by providing a description of the behavior, or model, of the system under test. A separate component then uses the model to generate test cases. Finally, the test cases are passed to a test driver or test harness, which is essentially a module that can apply the test cases to the system under test.

Given the same model and test driver, large numbers of test cases can be generated for various areas of testing focus, such as stress testing, regression testing, and verifying that a version of the software has basic functionality. It is also possible to find the most time-efficient test case that provides maximum coverage of the model. As an added benefit, when the behavior of the system under test changes, the model can easily be updated and it is once again possible to generate entire new sets of valid test cases.

(A) Model : - State machines are the heart of the model, linking to the test driver is cumbersome. A dedicated editor saves time and effort. The editor also enforces coherency in the model by using a set of rules defining legal actions. I am looking at WWF (state transition workflows to achieve this)

(B) Test case generator

The following algorithms can be considered for generating test cases

· The Chinese Postman algorithm is the most efficient way to traverse each link in the model. Speaking from a testing point of view, this will be the shortest test sequence that will provide complete coverage of the entire model. An interesting variation is called the State-changing Chinese Postman algorithm, which looks only for those links that lead to different states (i.e. it ignores self-loops).

· The Capacitated Chinese Postman algorithm can be used to distribute lengthy test sequences evenly across machines.

· The Shortest Path First algorithm starts from the initial state and incrementally looks for all paths of length 2, 3, 4, etc. This is essentially a depth-first search.

· The Most Likely First algorithm treats the graph as a Markov chain. All links are assigned probabilities and the paths with higher probabilities will be executed first. This enables the automation to be directed to certain areas of interest.

(C) Here is a possible implementation of a test driver outlined:


The decision module gets a test sequence from any one of the graph we have designed. It reads the test sequence input by input, determines which action is to be applied next, and calls the function in the implementation module that performs that input. The implementation module logs the action it is about to perform and then executes that input on the system under test. Next, it verifies whether the system under test reacted correctly to the input. Since the model accurately describes what is supposed to happen after an input is applied, oracles can be implemented at any level of sophistication.

A test harness designed in this particular way is able to deal with any input sequence because its decision logic is dynamic. In other words, rather than always executing the same actions in the same order each time, it decides at runtime what input to apply to the system under test. Moreover, reproducing a bug is simply a matter of feeding as input sequence the execution log of the test sequence that caused or revealed the failure.

Difficult test items

All things are difficult before they are easy

I think, in an effort to understand the philosophies of testing and how best we can get things going, If we can list down the top issues we face and try to find some patterns for them , it would be a good start.

I will begin with starting to think aloud on various topic areas where testers find testing hard. Let’s list the questions first and then have the community or Guruji answer them.

Difficult testing questions/areas which plague every testers

1. General Concerns

2. Estimation & Scheduling

3. Prioritization

4. Metrics

5. Testing Influence

6. Automation challenges

7. Product/Application wide issues

8. Risk Management

9. Testing Types

10. Research

Hope to add a few more in the days of thought


www.CodeNirvana.in

Powered by Blogger.

Translate

Total Pageviews

Copyright © T R I A G E D T E S T E R