Workload modeling in Performance testing

The process of identifying one or more composite application usage profiles for use in performance testing is known as “Workload Modeling”. Workload modeling can be accomplished in any number of ways, but to varying degrees the following activities are conducted, either explicitly or implicitly.

  1. Identify the objectives
  2. Indentify key usage scenarios. You may use the following limiting heuristics useful
    • Include contractually obligated usage scenarios
    • Include usage scenarios implied or mandated by performance testing goals and objectives
    • Include most common usage scenarios
    • Include business – critical usage scenarios
    • Include performance intensive usage scenarios
    • Include usage scenarios of technical concern, stakeholder concern & high visibility usage scenario
  3. Determine navigation paths for key scenarios
    • Identify the user paths within your web applications that are expected to have significant performance impact and that accomplish one or more of the identified key scenarios.
  4. Determine individual user data and variances
    • No matter how accurate the model representing navigation paths and usage scenarios is, it is not complete without accounting for the data used by and the variances associated with individual users. So spare some thoughts on – website metrics in web logs for usage sessions per period, session duration, page request distribution, interaction speed etc
  5. Determine the relative distribution of scenarios
  6. Identify target load levels
    • Benchmark – compare with industry standard
    • Baseline – create a new value for self use
  7. Prepare to implement the model

Performance testing Scenario

More often than not, i am pushed to the wall with this question on performance testing - “Our Website should support 2 million users in 1 hour time frame. The site admins want to test the site’s performance to ensure that it can sustain million users in one hour”

What should i do to ensure this? How do i go about doing this?

Very simple, You will need to break down this problem statement into Performance Objectives, Performance Budget constraints and Performance testing Objectives. Follow up with few questions and the answers will unfold

Performance objectives

  1. The web site should support a peak load of 2 million users in one hour time frame
  2. No transaction should be compromised due to application errors

Performance Budget/Constraints  : – These constrain the performance testing effort

  1. No server can have sustained processor utilization above 75 % under any anticipated load ( normal & Peak)
  2. Response times for all submissions should be less than 8 seconds during normal and peak load
  3. Again, no transaction loss due to application error.

Performance Testing Objectives : – These are the priority objectives that must be focussed in performance testing

  1. Simulate one user transaction scripted with 2 million  total virtual users in 1 hour distributed among 2 datacenters ( i am considering a WAN here)
  2. Simulate peak load of 2 million users visits in 1 hr period
  3. Test for 100 %  coverage on all transactions ( loads)
  4. Monitor for relevant component metrics – end user response times, error rate, database transactions per second and overall processor, memory, network and disk status for the DB server
  5. Test the error rate to determine the reliability metrics
  6. Test by using firewall and load balancing configurations

Some Questions that helped to determine relevant testing objectives

  1. What is the reason for deciding to test performance?
  2. In terms fo performance, what issues concern you most in relation to transactions that might cause data loss or user abandonment due to slow response times?
  3. What types of transaction(loads) are needed to be simulated relating to the business needs
  4. Where are the users located geographically while requesting for a transaction

Perf Counters in Website load testing using VSTS 2008

1. Request - Avg Req/Sec

Desired value range: High

This is the average number of requests per second, which includes failed and passed requests, but not cached requests, because they are not issued on web server. Please note that, all http requests, such as image, java-script, aspx, html files generates separate/individual/single request.


2. Request -    Avg Req Passed/Sec

Desired value range: High

While “Request - Avg Req/Sec” provides an average with respect to all passed and failed request, “Request -    Avg Req Passed/Sec” provided the average of passed requests. This info also helps to determine the average number of failed requests/sec.


3. Page -        Avg Page Time (Sec)

Desired value range: Low

While a single request refers to request to a single http elements (such as css, java-script files, images, aspx, html etc), a page is the container of all of the corresponding requests generated when a web page is requested (for instance via the browser address bar). “Page -        Avg Page Time (Sec)” counter refers to the average of total time taken to load a page with all of its http elements.


4. Test -        Total Test

Desired value range: High

For instance, we have created a web test, that contains two web pages, pushing on a button on the first page will re-direct the user to the second page, although there will be multiple entries will be involved for Requests and Pages counters, but the whole process will be considered as a single Test. This counter considers the total number of tests (which includes passed and failed tests) during the test period.


5. Scenario -        User Load

Desired value range: High

This counter considers the maximum user load that has been provided during the test run. Please note that, for Step Load pattern, where more user volume is added on step by step basis, the maximum user load will be counted through this counter parameter.


6. Errors -    Errors/Sec

Desired value range: Low

Includes average number of errors occurred per second, which includes all types of errors.

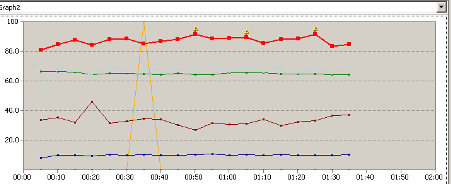
clip_image002


Hardware Related Performance Counters


7. Processor -    % Processor Time

Desired value range: Low

This is the number of processor time being utilized in percentage.


8. Memory -    Available MBytes

Desired value range: High

This the amount of Memory available in Mega byte.


9. Physical Disk -        Current Disk Queue Length

Desired value range: Low

It shows how many read or write requests are waiting to execute to the disk. For a single disk, it should idle at 2-3 or lower.


10. Network Interface -    Output Queue Length

Desired value range: Low

This is the number of packets in queue waiting to be sent. A bottleneck needs to be resolved if there is a sustained average of more than two packets in a queue.

WCF Performance Counters

WCF implements “out-of-the-box” performance counters to monitor WCF Services .WCF Performance Counters address four major areas: AppDomain, ServiceHost, EndPoint and Operation.

Note: WCF Performance Counters are all disabled by default, we have to enable them before we use them.

Use PerfMon.exe to add these WCF Counters to measure performance of Application Servers where WCF services are installed

Performance Counter

Context

Significance

Threshold

Tuning

WCF

Calls

Bottlenecks

The number of calls to this service.

Calls duration

Bottlenecks

The average duration of calls to this service.

Calls Failed

Bottlenecks

The number of calls with unhandled exceptions in this service

Calls Failed Per Second

Bottlenecks

The number of calls with unhandled exceptions in this service per second.

Calls Faulted Per Second

Bottlenecks

The number of calls to this service that returned faults per second.

Calls Outstanding

Bottlenecks

The number of calls to this service that are in progress.

Calls Per second

Bottlenecks

The number of calls to this service per second.

Instances

Bottlenecks

The total number of instances of the service

Queued Messages Dropped

Bottlenecks

The number of messages to this service that were dropped by the queued transport.

Queued Messages Dropped Per Second

Bottlenecks

The number of messages to this service that were dropped by the queued transport per second.

Queued Messages Rejected

Bottlenecks

The number of messages to this servcie that were rejected by the queued transport.

Queued Messages Rejected Per Second

Bottlenecks

The number of messages to this service that were rejected by the queued transport per second.

Queued Poison Messages

Bottlenecks

The number of messages to this service that were marked poisoned by the queued transport.

Queued Poison Messages Per Second/

Bottlenecks

The number of messages to this service that were marked poisoned by the queued transport per second.

Reliable Messaging Messages Dropped

Bottlenecks

The number of reliable messaging messages that were dropped in this service.

Reliable Messaging Messages Dropped Per Second

Bottlenecks

The number of reliable messaging messages that were dropped in this service per second.

Reliable Messaging Sessions Faulted

Bottlenecks

The number of reliable messaging sessions that were faulted in this service.

Reliable Messaging Sessions Faulted Per Second

Bottlenecks

The number of reliable messaging sessions that were faulted in this service per second.

Security Calls Not Authorized

Bottlenecks

The number of calls to this service that failed authorization.

Security Calls Not Authorized Per Second

Bottlenecks

The number of calls to this service that failed authorization per second.

Security Validation and Authentication Failure

Bottlenecks

The number of calls to this service that failed validation or authentication.

Security Validation and Authentication Failure Per Second

Bottlenecks

The number of calls to this service that failed validation or authentication per second.

Transacted Operations Aborted

Bottlenecks

The number of transacted operations with the outcome aborted in this service. Work done under such operations is rolled back. Resources are reverted to their previous state.

Transacted Operations Aborted Per Second

Bottlenecks

The number of transacted operations with the outcome aborted in this service per second. Work done under such operations is rolled back. Resources are reverted to their previous state.

Transacted Operations Committed

Bottlenecks

The number of transacted operations with the outcome committed in this service. Work done under such operations is fully committed. Resources are updated in accordance with the work done in the operation.

Transacted Operations Committed Per Second

Bottlenecks

The number of transacted operations with the outcome committed in this service per second. Work done under such operations is fully committed. Resources are updated in accordance with the work done in the operation.

Transacted Operations In Doubt

Bottlenecks

The number of transacted operations with an outcome in doubt in this service. Work done with an outcome in doubt is in an indeterminate state. Resources are held pending outcome.

Transacted Operations In Doubt Per Second

Bottlenecks

The number of transacted operations with an outcome in doubt in this service per second. Work done with an outcome in doubt is in an indeterminate state. Resources are held pending outcome.

Transaction Flowed

Bottlenecks

The number of transactions that flowed to operations in this service. This counter is incremented any time a transaction ID is present in the message that is sent to the service.

Transaction Flowed Per Second

Bottlenecks

The number of transactions that flowed to operations in this service per second. This counter is incremented any time a transaction ID is present in the message that is sent to the service.

www.CodeNirvana.in

Powered by Blogger.

Translate

Total Pageviews

Copyright © T R I A G E D T E S T E R